Below is my letter for 19Q4
In it, I shared a fun research of using Machine Learning to explore the reasons for value factor’s struggle and ways to improve it.
Download pdf:
Below is my letter for 19Q4
In it, I shared a fun research of using Machine Learning to explore the reasons for value factor’s struggle and ways to improve it.
Download pdf:
For what it worth, I have seen my concentrated portfolio (< 15 names) performed relatively closely to the broad market for years. However since last week, I started to see more deviation between these two. This observation coincides with the most significant value factor rebound seen in years. This WSJ article covered this interesting rebound of value factor [link], the author James Mackintosh however doesn’t think the rebound can last because he personally believes in the disrupters’ long term secular advantages.
Excerpts:
There are two leading explanations for value’s poor performance for the past decade. The first is that unending cheap money fueled spending sprees by disruptive tech stocks, allowing them to run at a loss and so steal business from traditional companies that try to make profits. Leading examples are Tesla, Uber and WeWork, and higher bond yields offer some hope that this might reverse.
I prefer a second, linked, explanation, that there’s a wave of technological change under way and the market has divided between the disrupters, who can afford to take advantage of it, and the disrupted, who can’t.
It is also important to think through why such reversal happens now. This Barron’s article [link] sourced many street strats who think it is caused by fixed income market, specifically a recent 10 year treasury yield spike.
Excerpts:
What was behind the sudden shift? Before last week, investors appeared to be betting that bond yields would fall. And for a while, that trade worked. Both momentum and low-volatility baskets are loaded with defensive stocks that tend to rise as yields fall—a signal that bond investors are losing faith in the economy.
No longer. The 10-year Treasury yield rose from 1.461% on Sept. 3 to 1.733% on Sept. 10, while the yield curve, which had been inverted, steepened. “The extreme factor moves we are seeing in the equity market are driven by activity in the fixed-income market,” Nomura Instinet strategist Joseph Mezrich wrote on Tuesday.
There’s a good reason for that. As investors turned more defensive this year, low-volatility stocks have attracted significant assets across both retail and institutional platforms. And that has made them expensive. Christopher Harvey at Wells Fargo now recommends that investors reduce their exposure to low-volatility stocks, a stark contrast to his position at the beginning of the year.
“About a year ago, we talked about low-vol strategies being one of the most unloved and underappreciated strategies in the marketplace,” wrote Harvey on Tuesday. “However, the style is no longer the technically oversold and underowned strategy it was in years past.”
As we’ve noted, the momentum basket, has recently shifted from being a group of fast-growing companies to include many of the market’s least-volatile stocks. Those are also the ones most dependent on yields going down, explains Bernstein analyst Sarah McCarthy.
So I decided to do a bit work to test these theories.
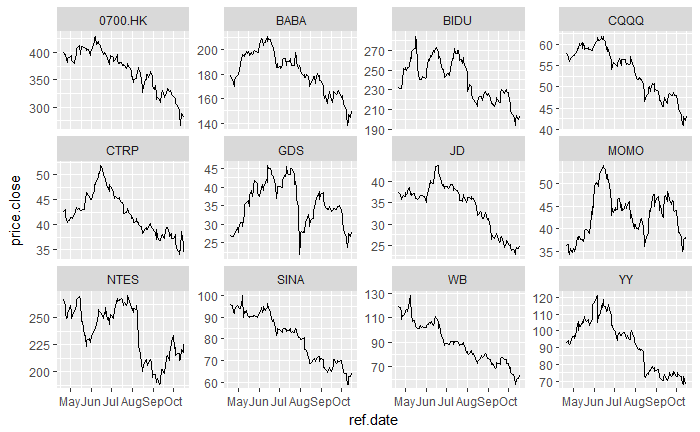
Chinese tech names are hit hard in the past few months. As holders of a handful of them, I’m curious to know what Mr. Market knows about them that I don’t.
Starting with Tencent, game monetization approval is indefinitely halted, corporate structure is shaking up. Maybe that’s why it lost 38% of its value in past 180 days. How about JD? Founder CEO Richard Liu got into this sexual assault scandal. That must be why it lost 48%% of its market value. YY? Oh, that must be because the new type of short video, e.g. Douyin/Tik Tok gaining traction leading to it’s 43%% market valuation evaporation. BABA? Jack Ma retiring must lead to 34% market value drop.
Well, if they are plausible, what about BIDU, WB, NTES, MOMO, SINA, CTRP & GDS who all happened to lose 30-50% from their recent high? Are there plausible fundamental reasons to explain each of them incurring so similar negative returns? I’m sure financial journalist could help find them if they want to. However, it looks to me such synchronized movements could hardly be explained well by idiosyncratic risks. I just want to see how much these movements are synchronized (correlated), thus can be attributed to market as a whole, rather than for each specific name.
I’m a R person, and below I try to do some simple statistic summary. I also attached my R scripts in markdown file for whomever is familiar with R and may want to play around with it.
Download R Markdown Notes: Link


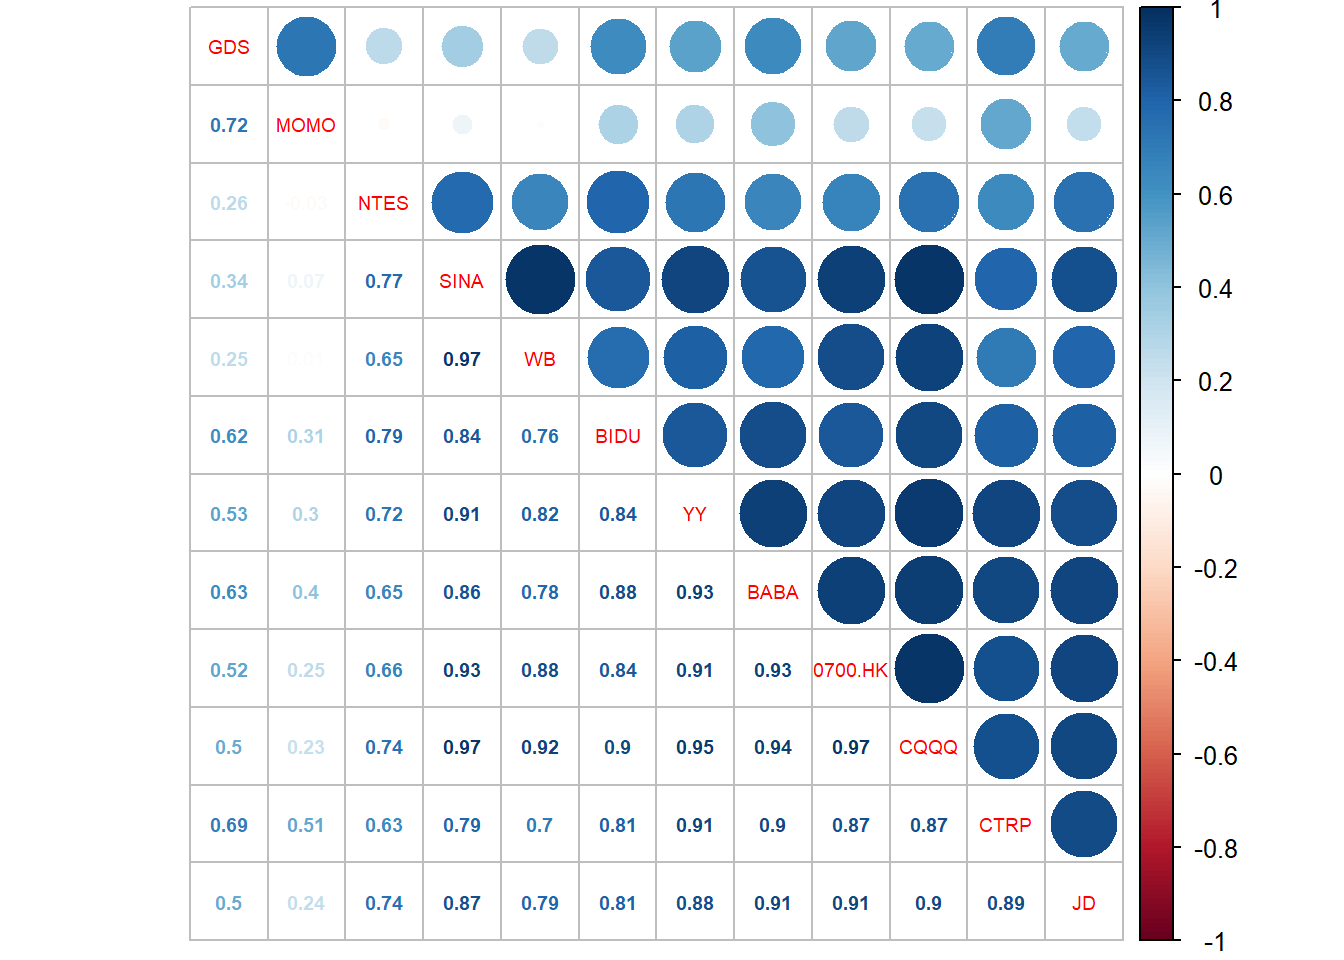
All these large blue dots indicate highly correlated daily price movement between these names, as well between single names and CQQQ (a Chinese tech ETF).
First, scatterplot the return of them, the best fit line already looks positive and close to 1.
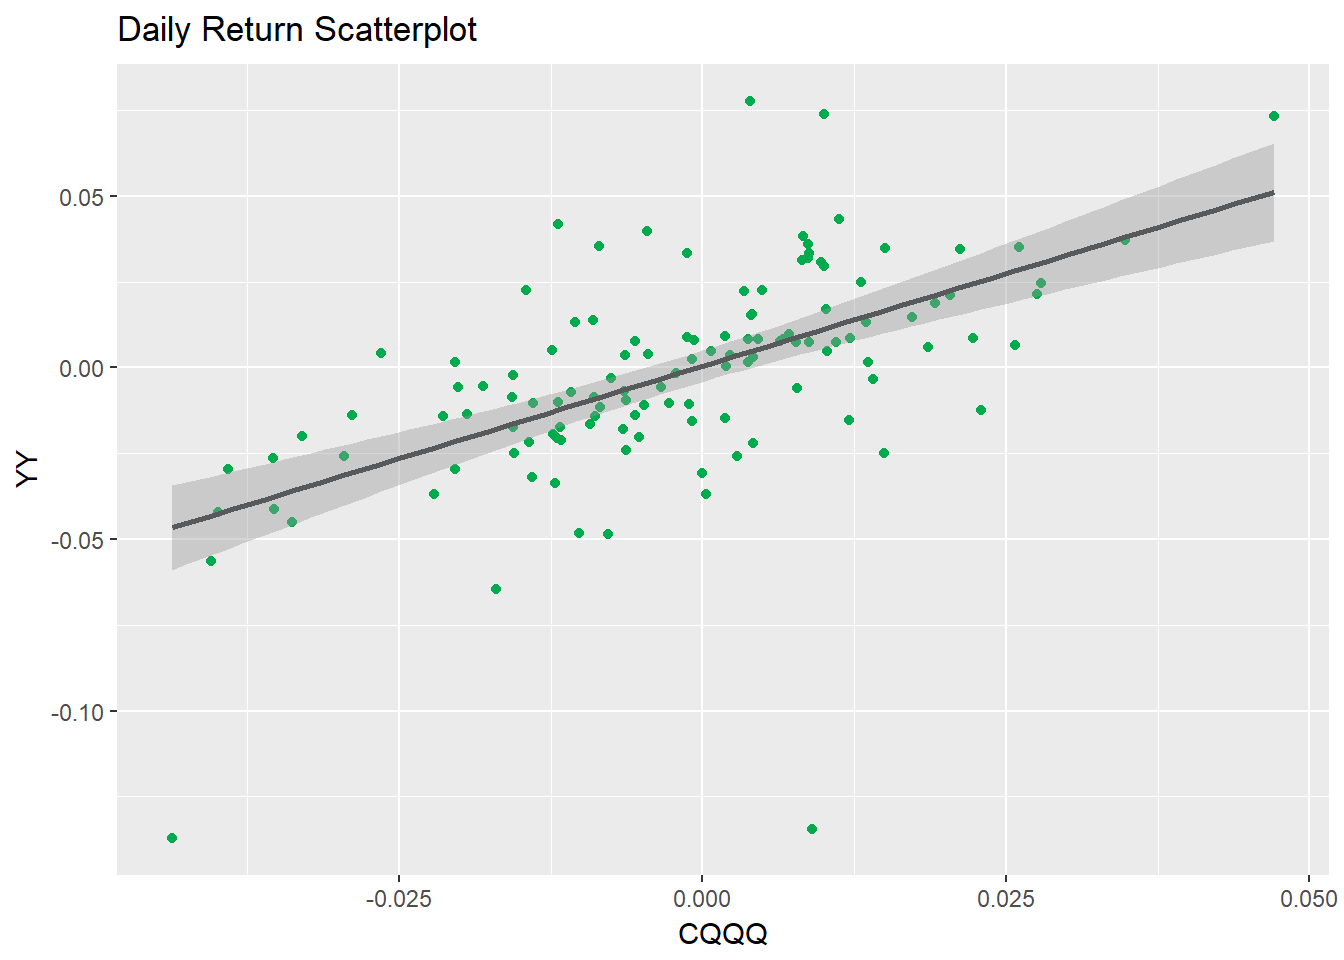
Based on below linear model, slope of CQQQ is highly statistically significant (p value basically is 0). In other words, CQQQ’s return has high power to explain YY’s return. Note YY is less than 3% of CQQQ’s holdings.
![]()

In conclusion, my interpretation is that Mr. Market may not know more about each of these individual company than I do, rather it may be more driven by overall fear to macro events.
