For what it worth, I have seen my concentrated portfolio (< 15 names) performed relatively closely to the broad market for years. However since last week, I started to see more deviation between these two. This observation coincides with the most significant value factor rebound seen in years. This WSJ article covered this interesting rebound of value factor [link], the author James Mackintosh however doesn’t think the rebound can last because he personally believes in the disrupters’ long term secular advantages.
Excerpts:
There are two leading explanations for value’s poor performance for the past decade. The first is that unending cheap money fueled spending sprees by disruptive tech stocks, allowing them to run at a loss and so steal business from traditional companies that try to make profits. Leading examples are Tesla, Uber and WeWork, and higher bond yields offer some hope that this might reverse.
I prefer a second, linked, explanation, that there’s a wave of technological change under way and the market has divided between the disrupters, who can afford to take advantage of it, and the disrupted, who can’t.
It is also important to think through why such reversal happens now. This Barron’s article [link] sourced many street strats who think it is caused by fixed income market, specifically a recent 10 year treasury yield spike.
Excerpts:
What was behind the sudden shift? Before last week, investors appeared to be betting that bond yields would fall. And for a while, that trade worked. Both momentum and low-volatility baskets are loaded with defensive stocks that tend to rise as yields fall—a signal that bond investors are losing faith in the economy.
No longer. The 10-year Treasury yield rose from 1.461% on Sept. 3 to 1.733% on Sept. 10, while the yield curve, which had been inverted, steepened. “The extreme factor moves we are seeing in the equity market are driven by activity in the fixed-income market,” Nomura Instinet strategist Joseph Mezrich wrote on Tuesday.
There’s a good reason for that. As investors turned more defensive this year, low-volatility stocks have attracted significant assets across both retail and institutional platforms. And that has made them expensive. Christopher Harvey at Wells Fargo now recommends that investors reduce their exposure to low-volatility stocks, a stark contrast to his position at the beginning of the year.
“About a year ago, we talked about low-vol strategies being one of the most unloved and underappreciated strategies in the marketplace,” wrote Harvey on Tuesday. “However, the style is no longer the technically oversold and underowned strategy it was in years past.”
As we’ve noted, the momentum basket, has recently shifted from being a group of fast-growing companies to include many of the market’s least-volatile stocks. Those are also the ones most dependent on yields going down, explains Bernstein analyst Sarah McCarthy.
So I decided to do a bit work to test these theories.
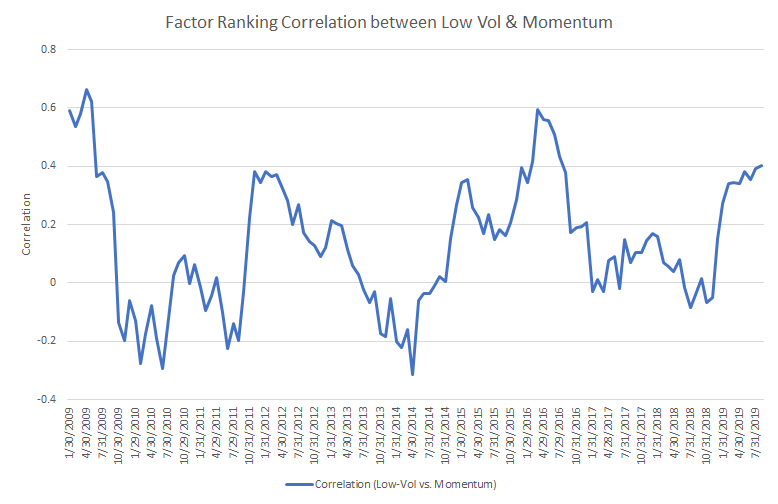
- Higher correlation (overlapping) between Low Volatility & Momentum factor? – True. See below chart of the ranking correlation between these two factors (US All Cap universe). Higher number (closer to 1) indicates more overlap, vice versa. It is now at 40%, highest point since first half of 2016.
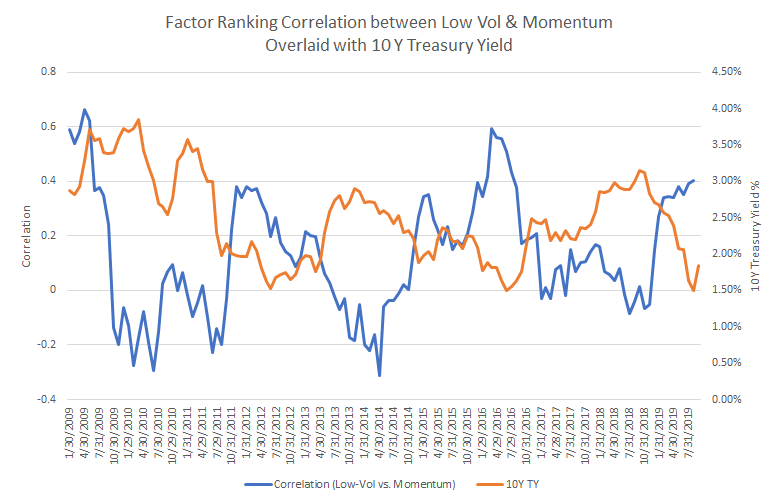
- Above shift is caused by bond market/treasury yield? – True, but… below is the same chart, overlaid with monthly 10 year treasury yield series. I did see strong correlation (especially after 2013 when the rate hit new low below 2%, the correlation of these two series are strikingly -73%), but I cannot comment on causality (i.e. which one cause which one).
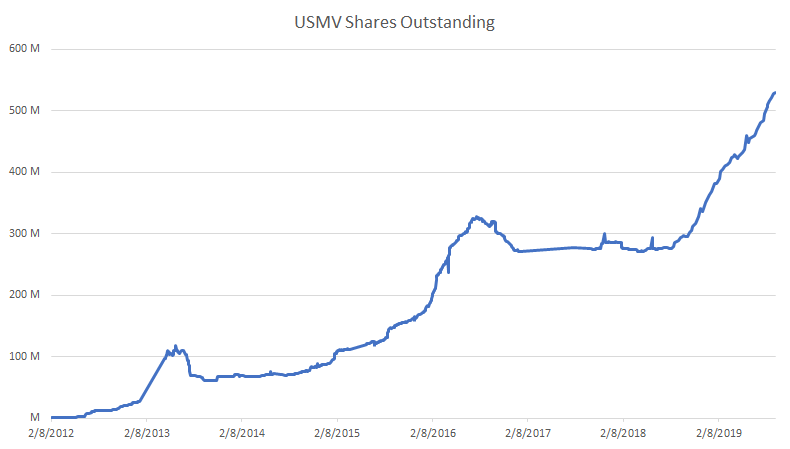
- They implied there was outflow of low-vol & momentum strategy, thus the momentum names underperforming? – Not true (at least from retail flow). USMV is the largest retail vehicle for low vol strategy. Because of the creation/redemption mechanism of ETF, the # of shares outstanding could be used as a proxy for inflow/outflow indicator. I cannot see such an outflow, in fact, there are monotonic inflows recently.
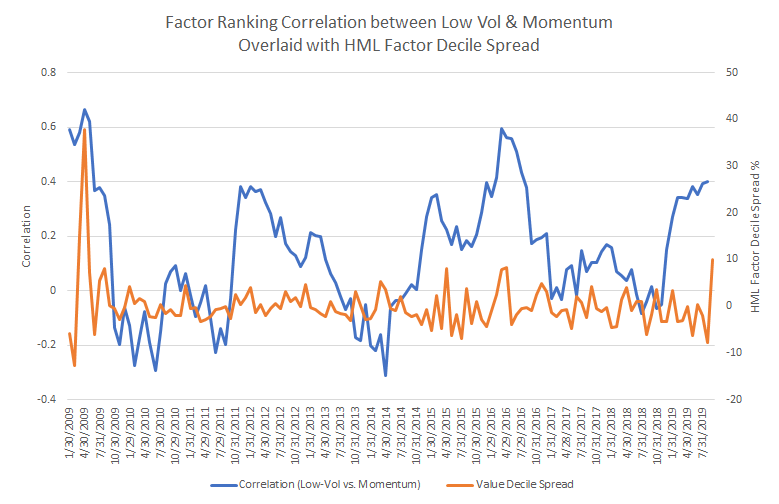
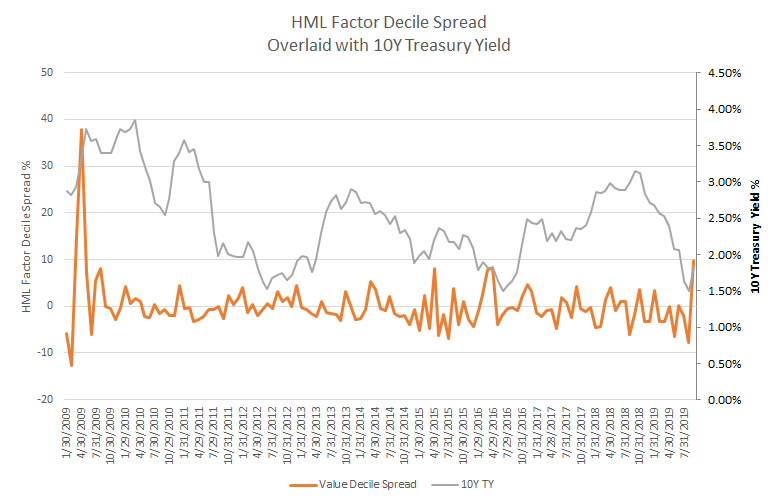
- Value factor rebound relationship to bond market? – Not sure. Below are the chart of the famous value HML factor monthly decile spread (avg return of highest decile book-to-market ratio – avg return of the lowest decile book-to-market ratio) with 1) Factor Ranking Correlation between Low Vol & Momentum & 2) 10Y Treasury Yield respectively. For both combination, the correlation for past 10 years were about 20%, relatively weak.
Last, I want to share a relevant working paper on explaining the “demise of value investing”.
https://papers.ssrn.com/sol3/papers.cfm?abstract_id=3442539
This paper argues that the reason for value (the factor) not working is because of “(1) accounting deficiencies causing systematic misidentification of value, and particularly of glamour (growth) stocks, and (2) fundamental economic developments which slowed down significantly the reshuffling of value and glamour stocks which drove the erstwhile gains from the value strategy.”
Point 1 is intuitive. As new businesses today increasingly run on intangible assets (brands, software, digital content & processes, etc.) than tangible ones (plants, factories & equipment, etc.), the investment to build these intangible assets are usually intangible as well (thus hard to measure). For example, a typical software company would use heavy Sales & Marketing budgets to acquire new customers who usually can remain as customer for 5-10 years. This so called customer acquisition cost (CAC) however is fully expensed (in SG&A) on the first year through income statement, which should really be amortized in a schedule matches expected customer retention period (similar to how an equipment investment is depreciated in a schedule according to expected useful life). This means these intangible investments never reach the balance sheet (i.e. never reflected on book value), thus creating a distortion when categorizing stock style simply using book to market ratio.
Point 2 basically argues it now takes longer for value/growth trend to mean reverting (which is the core premise of value factor being working). To measure this “slowdown” in reversion, the authors used a few ways: rank correlation, length of staying in the specific bucket & large stock price upticks and downticks, all of which show supporting evidences. On explaining the “why”, the authors pointed to shrinkage in bank lending (for value companies) and structural advantages (e.g. scalability, network effects, etc.) of growth companies (who are mostly software, pharmaceuticals & electronics businesses). I personally think the former is less convincing than the latter.
Based on these reasoning, the paper naturally reaches the conclusion that the authors don’t think the value factor (based on simple b/m ratio) can rebound.
On point 1, O’Shaughnessy AM had done a quality study (in April 2018) on exploring a few more factors contributing the book value distortion (conservatism in depreciation, buybacks & dividends etc.):
https://www.osam.com/Commentary/negative-equity-veiled-value-and-the-erosion-of-price-to-book
Conclusion
Some quick takeaway as a quantamental:
1) Value factor is rebounding strongly, there are some weak evidences showing it may be driven by bond/yield market;
2) low volatility & momentum factors are indeed more correlated recently and there might be further implication on how market behave in short term;
3) Market may have been very efficient in valuing the growth/glamour bucket stocks, even with these accounting deficiencies &
4) deep value (b/m ratio factor) may not be entirely dead, but that doesn’t mean growth/glamour bucket has to do poorly.
