Chinese tech names are hit hard in the past few months. As holders of a handful of them, I’m curious to know what Mr. Market knows about them that I don’t.
Starting with Tencent, game monetization approval is indefinitely halted, corporate structure is shaking up. Maybe that’s why it lost 38% of its value in past 180 days. How about JD? Founder CEO Richard Liu got into this sexual assault scandal. That must be why it lost 48%% of its market value. YY? Oh, that must be because the new type of short video, e.g. Douyin/Tik Tok gaining traction leading to it’s 43%% market valuation evaporation. BABA? Jack Ma retiring must lead to 34% market value drop.
Well, if they are plausible, what about BIDU, WB, NTES, MOMO, SINA, CTRP & GDS who all happened to lose 30-50% from their recent high? Are there plausible fundamental reasons to explain each of them incurring so similar negative returns? I’m sure financial journalist could help find them if they want to. However, it looks to me such synchronized movements could hardly be explained well by idiosyncratic risks. I just want to see how much these movements are synchronized (correlated), thus can be attributed to market as a whole, rather than for each specific name.
I’m a R person, and below I try to do some simple statistic summary. I also attached my R scripts in markdown file for whomever is familiar with R and may want to play around with it.
Download R Markdown Notes: Link
- Here is how daily close price looks in past 180 trading days:

- Here is the performance and max drawdown in same period

- here is the correlation matrix & its visualization

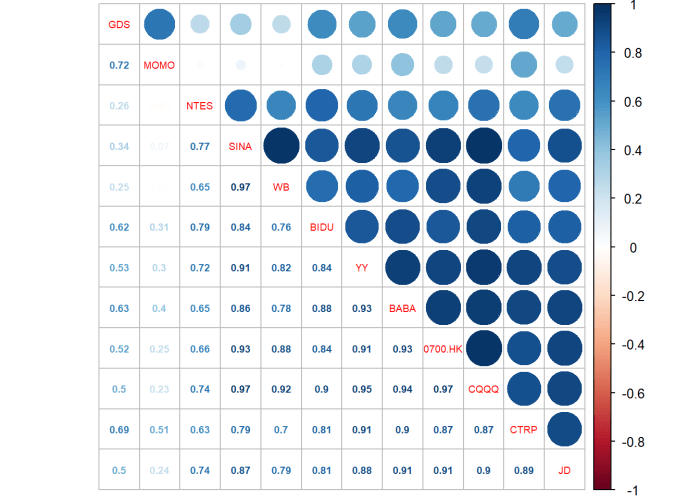
All these large blue dots indicate highly correlated daily price movement between these names, as well between single names and CQQQ (a Chinese tech ETF).
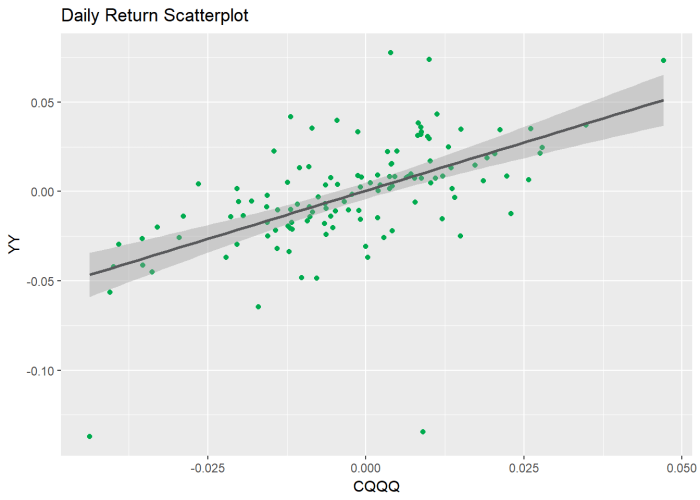
- Let’s try to do a linear regression for YY to see how we can use CQQQ’s return to explain YY’s.
First, scatterplot the return of them, the best fit line already looks positive and close to 1.
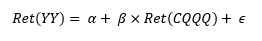
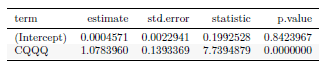
Based on below linear model, slope of CQQQ is highly statistically significant (p value basically is 0). In other words, CQQQ’s return has high power to explain YY’s return. Note YY is less than 3% of CQQQ’s holdings.
In conclusion, my interpretation is that Mr. Market may not know more about each of these individual company than I do, rather it may be more driven by overall fear to macro events.
